Design of Experiments
Design of Experiments(DOE)
- A statistics-based approach to designing experiments
- A methodology to obtain knowledge of a complex, multivariable process with the fewest trials possible.
- An optimisation of the experimental process itself.
- The backbone of any product design as well as any process/ product improvement efforts.
To gave us a better understanding and practice on Design of Experiments, we are tasked to complete 3 pre-practical task of analyzing experiment data using graphical method such as Full and Fractional Factorial graph. Through this activity, we had a better understanding and able to rank them in the order of most significant factors.
Next, we were assigned to complete the individual case study for Design of Experiments. Being the CFO(Chief Financial Officer) I was task to work on case study 1.
Case Study 1:
What could be simpler than making microwave popcorn? Unfortunately, as everyone who has ever made popcorn knows, it’s nearly impossible to get every kernel of corn to pop. Often a considerable number of inedible “bullets” (unpopped kernels) remain at the bottom of the bag. What causes this loss of popcorn yield? In this case study, three factors were identified:
1. Diameter of bowls to contain the corn, 10 cm and 15 cm
2. Microwaving time, 4 minutes and 6 minutes
3. Power setting of microwave, 75% and 100%
The factors
Factor A= diameter
Factor B= microwaving time
Factor C= power

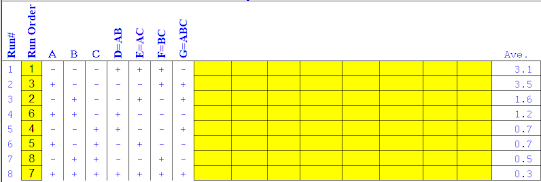

After the values is selected, this is how the graph of full factorial looks like:

- Factor C (power)
- Factor B (microwaving time)
- Factor A (Diameter)
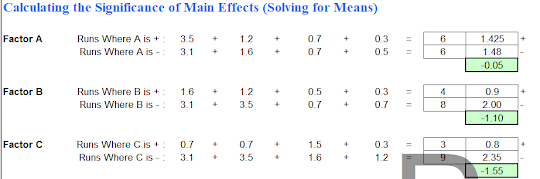
- When the diameter of bowl(factor A) increases from 10cm(-) to 15cm(+), the bullet formed decreases from 1.48g to 1.425g
- When the microwaving time(factor B) Increases from 4minutes(-) to 6minutes(+), the bullets formed decreases from 2.0g to 0.9 g.
- When the Power setting of microwave (factor C) increases from 75%(-) to 100%(+), the bullets formed decreases from 2.35g to 0.8g
- For factor A, when the bowl diameter increases, the bullets formed decreases but it is not as significant as compared to the others factors. Hence, it is represented in the graph with the least steep gradient.
- For factor B, when microwaving time increases, it increases the tendency of the corn being pop which reduced the amount of bullets formed. This factor is more significant than Factor A hence it is represented by a line steeper than Factor A.
- For Factor C, When the power of the microwave increases this allows more heat to be gained and hence increases the number of corn being popped which reduces the mass of bullets formed. Being the most significant factor, the line that represent Factor C is the steepest line
- Interaction effects of factors with full factorial graph


- Factor C (power)
- Factor B (microwaving time)
- Factor A (Diameter)
- When the diameter of bowl(factor A) increases from 10cm(-) to 15cm(+), the bullet formed decreases from 1.8g to 0.95g
- When the microwaving time(factor B) Increases from 4minutes(-) to 6minutes(+), the bullets formed decreases from 1.9g to 0.85g.
- When the Power setting of microwave (factor C) increases from 75%(-) to 100%(+), the bullets formed decreases from 2.15g to 1.1g
- For factor A, when the bowl diameter increases, the bullets formed decreases but it is not as significant as compared to the others factors. Hence, it is represented in the graph with the least steep gradient.
- For factor B, when microwaving time increases, it increases the tendency of the corn being pop which reduced the amount of bullets formed. This factor is more significant than Factor A hence it is represented by a line steeper than Factor A.
- For Factor C, When the power of the microwave increases this allows more heat to be gained and hence increases the number of corn being popped which reduces the mass of bullets formed. Being the most significant factor, the line that represent Factor C is the steepest line

Comments
Post a Comment